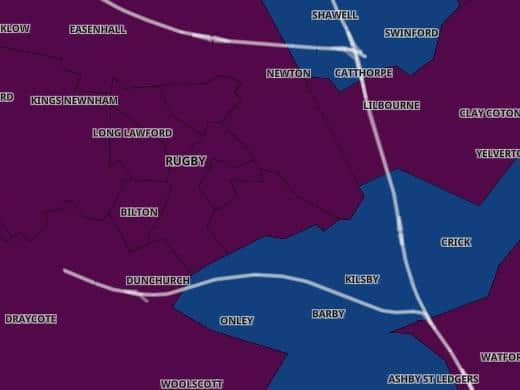
Here's a breakdown of the latest Covid figures for the individual areas in and around Rugby
and live on Freeview channel 276
The Rugby borough has the highest Covid rate in Warwickshire, according to the latest data.
The borough saw a 22.5 per cent increase in Covid cases (609 cases) over the seven days up to January 8.
Advertisement
Hide AdAdvertisement
Hide AdOverall, the borough's rolling rate of positive cases is 559 per 100,000 people - above the national average.


Warwickshire's overall figure is 438.8 per 100,000 people - below the national average.
Inside the Rugby borough, the Town North and Newbold on Avon ward saw the largest increase of cases over the seven days - 25 new cases, an increase of nearly 75.8 per cent). That ward now has the highest rolling rate - 765.4 per 100,000 people.
In the rural areas, the Brinklow, Wolvey and Clifton ward saw a 69.4 per cent increase, with 83 new cases.
Advertisement
Hide AdAdvertisement
Hide AdThe good news is that the increases were much smaller in some areas, with a few wards seeing decreases - Eastlands, Dunchurch, Stretton-on-Dunsmore, Marton, Wolston, Binley Woods and Ryton.
Here are the figures for the whole borough, the county and the individual wards in the borough.
The figures cover the seven days up to January 8.
Seven day rates are expressed per 100,000 population and are calculated by dividing the seven day count by the area population and multiplying by 100,000.
OVERALL
Rugby
Total cases: 609
The rate has increased relative to the previous week by 112 (22.5%)
Rolling rate: 559.0 (above the national average)
Warwickshire
Total cases: 2,536
Advertisement
Hide AdAdvertisement
Hide AdThe rate has increased relative to the previous week by 245 (10.7%)
Rolling rate: 438.8 (below the national average)
INDIVIDUAL WARDS
Town South & School
Total cases: 31
The rate has increased relative to the previous week by 5 (19.2%)
Rolling rate: 519.3
Town East
Total cases: 39
The rate has increased relative to the previous week by 10 (34.5%)
Rolling rate: 550.8
Town North & Newbold on Avon
Total cases: 58
The rate has increased relative to the previous week by 25 (75.8%)
Rolling rate: 765.4
New Bilton
Total cases: 42
Advertisement
Hide AdAdvertisement
Hide AdThe rate has increased relative to the previous week by 8 (23.5%)
Rolling rate: 501.3
Overslade & Bilton
Total cases: 61
The rate has increased relative to the previous week.20 (48.8%)
Rolling rate: 568.5
Eastlands
Total cases: 28
The rate has decreased relative to the previous week by 4 (-12.5%)
Rolling rate: 476.0
Hillmorton
Total cases: 53
The rate has increased relative to the previous week by 4 (8.2%)
Rolling rate: 528.1
Brownsover
Total cases: 53
Advertisement
Hide AdAdvertisement
Hide AdThe rate has increased relative to the previous week by 3 (6.0%)
Rolling rate: 508.2
Braunston & Crick
Total cases: 35
The rate has increased relative to the previous week by 4 (12.9%)
Rolling rate: 396.7
Dunchurch, Stretton-on-Dunsmore & Marton
Total cases: 38
The rate has decreased relative to the previous week by 5 (-11.6%)
Rolling rate: 445.8
Brinklow, Wolvey & Clifton
Total cases: 83
The rate has increased relative to the previous week by 34 (69.4%)
Rolling rate: 620.9
Wolston, Binley Woods & Ryton
Total cases: 34
The rate has decreased relative to the previous week by 4 (-10.5%)
Rolling rate: 448.1