These are the two areas with the highest - and lowest - Covid rates in the Leamington, Warwick and Kenilworth area
and live on Freeview channel 276
The Warwick district has seen a small increase in Covid-19 cases over the latest seven-day period - bit it still has one of the lowest rates in the county.
Overall, the latest Government data shows that Warwickshire has seen a 10 per cent decrease in positive cases over seven days to January 21.
Advertisement
Hide AdAdvertisement
Hide AdBut the latest data shows a 5.8 per cent in crease in the Warwick district. However, the district still has the second lowest rate in Warwickshire, with a rolling rate of 279 cases per 100,000 people - the Stratford district has the lowest with 225.2.

Both are way below the national average.
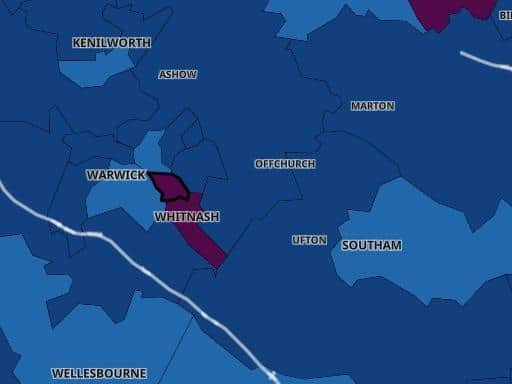
The two wards with the highest rolling rates in the Warwick district are Whitnash (458.5) and Leamington Brunswick (438.9) - both wards are marked in a dark red colour on the Government's latest data map, which indicates that they are above the national average.
Leamington West and Milverton has the lowest rate - 155.4 per 100,000 - while Southam, Stockton and Napton are not far behind with 183.7.
Here are the figures for the county, district and the highest/lowest wards in the district for the seven days to January 21.
Advertisement
Hide AdAdvertisement
Hide Ad(Seven–day rates are expressed per 100,000 population and are calculated by dividing the seven day count by the area population and multiplying by 100,000).
Warwickshire
Total cases: 1,863
The rate has decreased relative to the previous week by 216 (-10.4%)
Rolling rate: 322.4
Warwick district
Total cases: 401
The rate has increased relative to the previous week by 22 (5.8%)
Rolling rate: 279.0
Wards with the highest rates:
Whitnash
Total cases: 45
The rate has increased relative to the previous week by 6 (15.4%)
Rolling rate: 458.5
Leamington Brunswick
Total cases: 48
Advertisement
Hide AdAdvertisement
Hide AdThe rate has increased relative to the previous week by 10 (26.3%)
Rolling rate: 438.9
Wards with the lowest rates:
Leamington West and Milverton
Seven days to 21 January 2021
Total cases: 15
The rate has decreased relative to the previous week by 7 (-31.8%)
Rolling rate: 155.4
Southam, Stockton and Napton
Total cases: 18
The rate has decreased relative to the previous week by 11 (-37.9%)
Rolling rate: 183.7