Warwickshire's Covid rate reaches an important milestone as Rugby battles to move out of tier three before Christmas
and live on Freeview channel 276
Warwickshire's latest Covid-19 rate has now fallen under the national average - which gives us hope that the county will be moved down a tier before Christmas.
According to the latest Government figures, Warwickshire has seen a 32.2% decrease in positive Covid-19 cases from the seven days to December 2 - the same percentage fall over the previous seven days.
Advertisement
Hide AdAdvertisement
Hide AdThe rolling rate is now 114.2 per 100,000 people, which is below the national average.

In the seven days before that, the rolling rate was 158.7 per 100,000 people, which was just above the national average.
The Government has put the whole county together so the figures for every district and borough are now important to all residents.
MPs and community leaders are hoping that the Government localised the restrictions further - for instance, Stratford has one of the lowest rates in the country but is in tier three.
Advertisement
Hide AdAdvertisement
Hide AdThe Warwick district (100.9) and the Rugby borough (114.7) are also both below the national average.
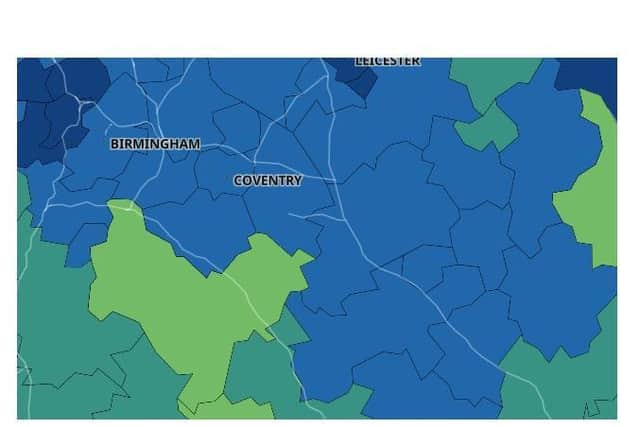
Coventry, Solihull, North Warwickshire and Nuneaton and Bedworth rate's are all still above the national average but they are falling.
However, the tier rankings are based on other measures such as rates among the over 60s and pressure on NHS services, and not just the rolling rate per 100,000 people.
Here are the figures for each district and borough in and around Warwickshire, Coventry and Solihull:
Advertisement
Hide AdAdvertisement
Hide AdFigures from the seven days to December 2. Seven–day rolling rates are expressed per 100,000 population and are calculated by dividing the seven day count by the area population and multiplying by 100,000.
Warwickshire
Seven days to December 2
Total cases: 660
The rate has decreased relative to the previous week by 314 (-32.2%)
Rolling rate 114.2
This is below the national average
Warwick district
Total cases: 145
The rate has decreased relative to the previous week by 25 (-14.7%)
Rolling rate: 100.9
This is below the national average
Rugby borough
Total cases: 125
The rate has decreased relative to the previous week by 63 (-33.5%)
Rolling rate: 114.7
This is below the national average
Stratford-on-Avon district
Total cases: 59
Advertisement
Hide AdAdvertisement
Hide AdThe rate has decreased relative to the previous week by 61 (-50.8%)
Rolling rate: 45.4
This is well below the national average
Nuneaton and Bedworth
Total cases: 235
The rate has decreased relative to the previous week by 93 (-28.4%)
Rolling rate: 180.9
This is above the national average
North Warwickshire
Total cases: 96
The rate has decreased relative to the previous week by 72 (-42.9%)
Rolling rate: 147.1
This is above the national average
Coventry
Total cases: 499
The rate has decreased relative to the previous week by 220 (-30.6%)
Rolling rate: 134.3
This is above the national average
Solihull
Total cases: 330
The rate has decreased relative to the previous week by 94 (-22.2%)
Rolling rate: 152.5
This is above the national average