

Online Marketing Surgery and BLG Development Finance put together the House Price Change Report, which looks at how much median house prices went up and down in Rugby between September 2023 and September 2024.
They used data from the Office for National Statistics to compare median house prices in different areas of Rugby for those two dates. Then they worked out which areas had the biggest increases and decreases.
Click through our gallery to see if your neighbourhood made the list.
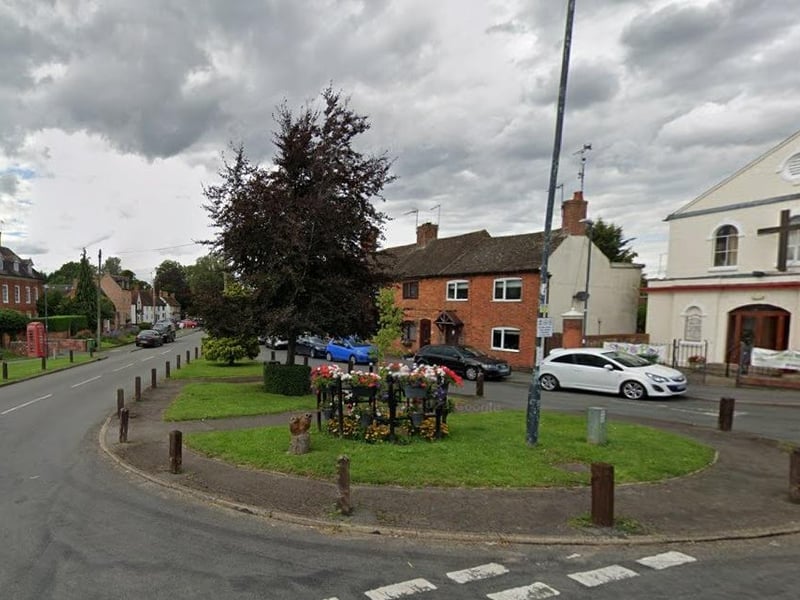
5. Wolston, Binley Woods & Ryton - decrease of 6.3%
Property Price Median (year ending September 2023): £320,000 Property Price Median (year ending September 2024): £300,000 Percentage Decrease (September 2023/September 2024): 6.3% Photo: Google
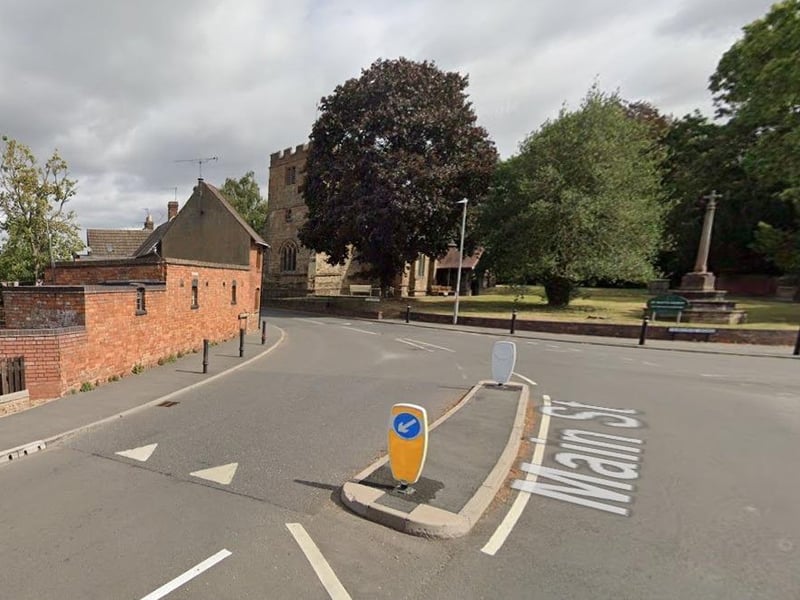
6. Houlton, Clifton & Brownsover North - increase of 0.3%
Property Price Median (year ending September 2023): £340,000 Property Price Median (year ending September 2024): £340,998 Percentage Increase (September 2023/September 2024): 0.3% Photo: Google
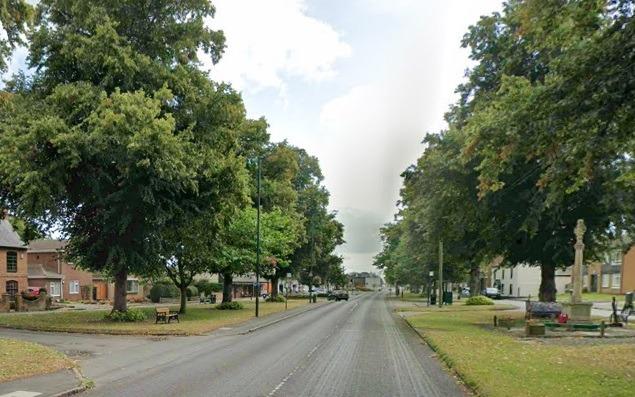
7. Town East - increase of 3.7%
Property Price Median (year ending September 2023): £205,000 Property Price Median (year ending September 2024): £212,500 Percentage Increase (September 2023/September 2024): 3.7% Photo: Google
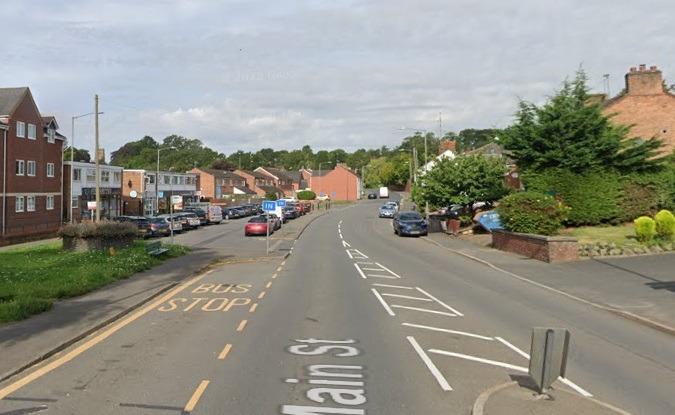
8. Town North & Newbold on Avon - increase of 5%
Property Price Median (year ending September 2023): £200,000 Property Price Median (year ending September 2024): £210,000 Percentage Increase (September 2023/September 2024): 5.0% Photo: Google