

A new report ranks neighbourhoods in the Warwick district based on how much house prices have increased over the past year.
Online Marketing Surgery and BLG Development Finance put together the House Price Change Report, which looks at how much median house prices went up and down in the district between September 2023 and September 2024.
They used data from the Office for National Statistics to compare median house prices in different areas of the Warwick district for those two dates. Then they worked out which areas had the biggest increases.
Some places saw property prices increase by as much as 10 per cent, while others saw an 11.5 per cent decrease.
Here’s our gallery of the top five neighbourhoods in the Warwick district with the highest increase and highest decrease in property prices.
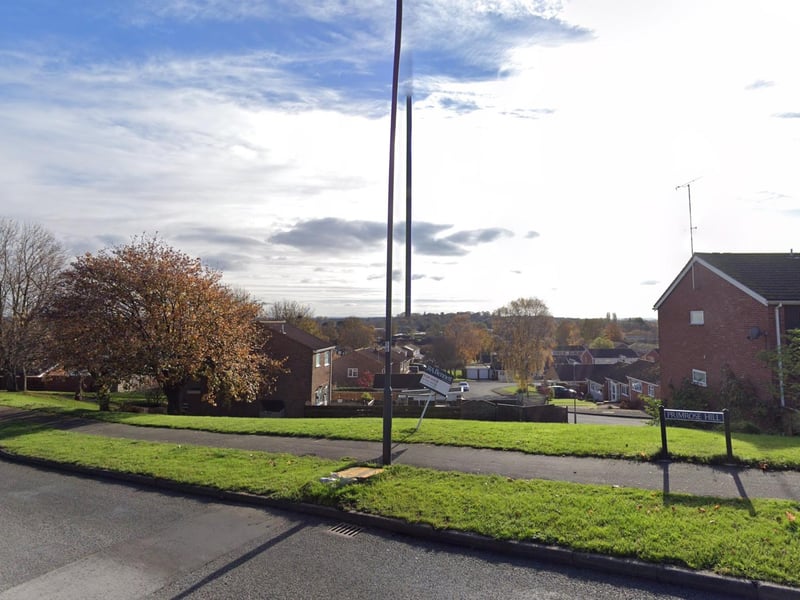
5. Warwick North - decrease of 4.0 per cent
Property Price Median (year ending September 2023): £306,250 Property Price Median (year ending September 2024): £294,000 Photo shows Primrose Hill in the Woodloes. Photo: Google
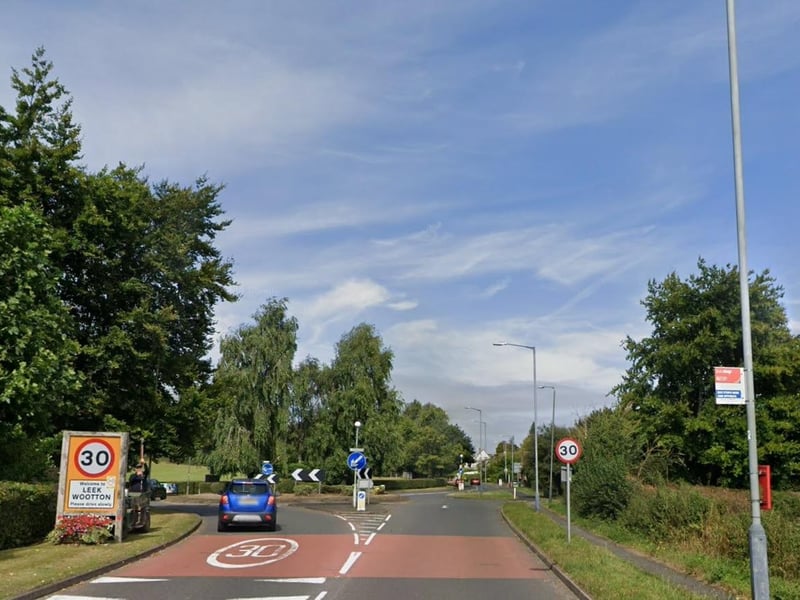
6. Kingswood and Leek Wootton - increase of 0.4 per cent
Property Price Median (year ending September 2023): £622,495 Property Price Median (year ending September 2024): £625,260 Photo: Google
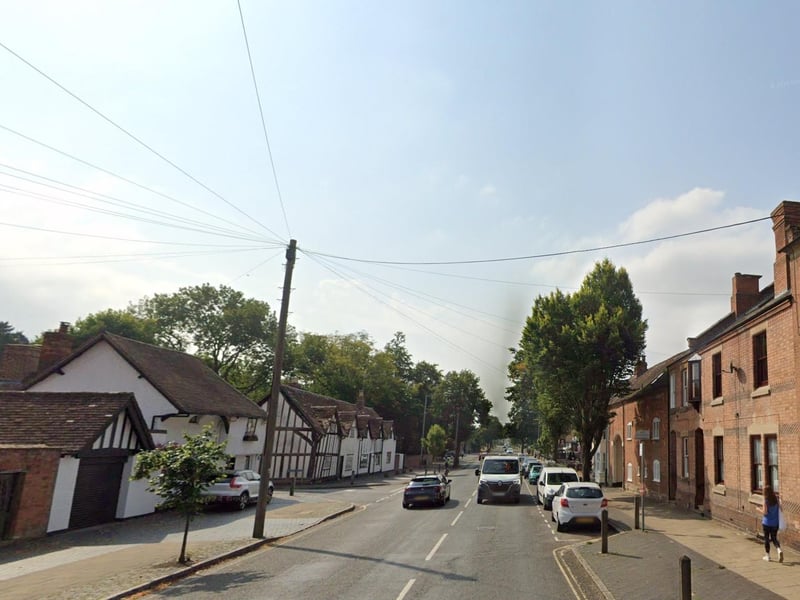
7. Warwick South West and Aylesford - increase of 2.7 per cent
Property Price Median (year ending September 2023): £292,000 Property Price Median (year ending September 2024): £300,000 Photo shows West Street in Warwick. Photo: Google
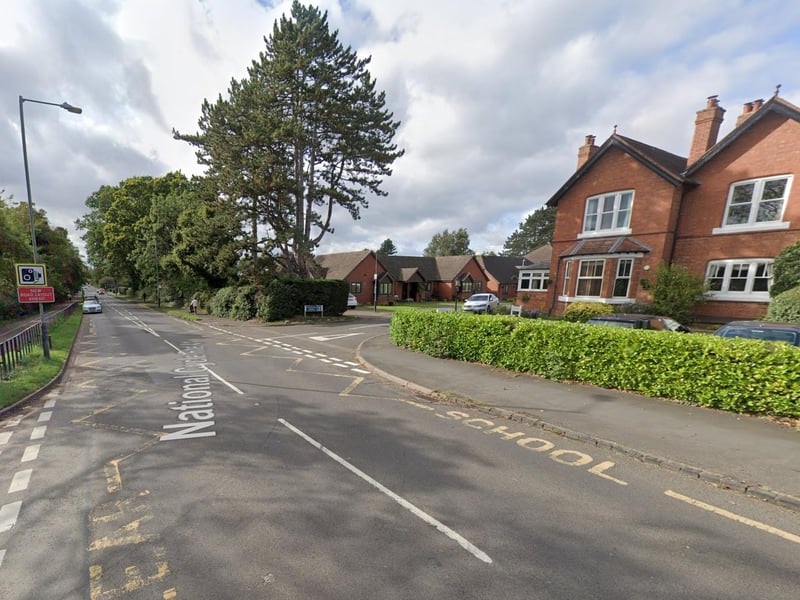
8. Warwick South East, Myton and Heathcote - increase of 3.2 per cent
Property Price Median (year ending September 2023): £370,000 Property Price Median (year ending September 2024): £382,000 Photo shows Myton Road Photo: Google