How house prices have changed where you live
and live on Freeview channel 276
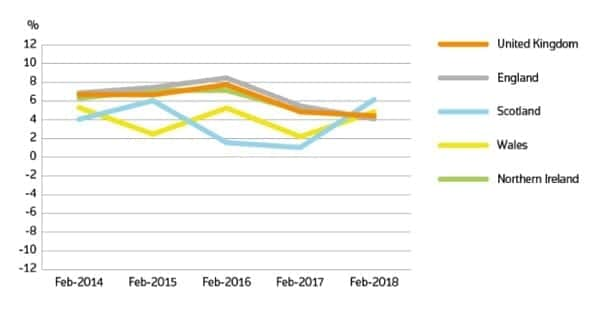
The cost of property continues to rise, with the average UK house price reaching £225,047 in February, an increase of 4.4% annually.
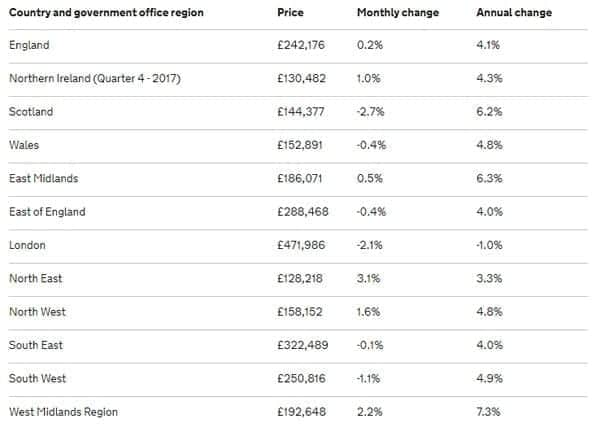
According to the latest data from the Office for National Statistics, the average house in England costs £242,176, a 4.1% annual rise, compared to £144,377 in Scotland (up 6.2%), £152,891 in Wales (up 4.8%) and £130,482 in Northern Ireland (up 4.3%).
Advertisement
Hide AdAdvertisement
Hide AdOwners of detached houses saw the highest rise by type of property (up 5.6%), while flats or maisonettes recorded the lowest increase (up 1.8%).


Graphic: ONS
The area of the UK with the largest rise in house prices year-on-year was the Orkney Islands (14.1%), while in England it was Richmondshire (12.9%) and in Wales it was Conwy (10.5%).
Cities that recorded the highest increases included Coventry (10.7%), Liverpool (10.5%), Leicester (8.3%) and Peterborough (7.9%)
In London, average house prices decreased by 1% in the year to February (down from a 1.3% increase in the year to January 2018). This is the lowest annual growth in London since September 2009 when it was negative 3.2%.
Advertisement
Hide AdAdvertisement
Hide Ad

The London borough of Tower Hamlets saw the sharpest downturn in the whole of the UK, with a 7.9% fall to £432,869.
The area of the UK with the lowest average house price is Burnley (£79,208), which still recorded a 2.9% increase.
The regional breakdown:
House prices by city (price / annual change):


Aberdeen: £159,653 / -1.5%Blackpool: £105,743 / 2.0%Bristol: £275,687 / 5.7%Birmingham: £179,201 / 6.6%Bradford: £133,248 / 1.9%Brighton and Hove: £361,378 / 4.1%Coventry: £181,940 / 10.7%Dundee: £116,910 / 0.4%Edinburgh: £250,986 / 11.2%Glasgow: £126,216 / 7.7%Hull: £109,156 / 2.4%Leeds: £178,607 / 5.7%Leicester: £163,912 / 8.3%Liverpool: £132,804 / 10.5%London: £535,274 / -1%Manchester: £171,436 / 7.4%Newcastle upon Tyne: £161,211 / 4.1%Norwich: £203,146 / 5.4%Peterborough: £187,551 / 7.9%Plymouth: £174,715 / 5.3%Portsmouth: £206,329 / 6.8%Preston: £130,192 / 3.9%Salford: £161,378 / 8.5%Sheffield: £158,176 / 5%Sunderland: £113,233 / 2.6%Wakefield: £144,978 / 6.2%York: £239,187 / 0.6%
Source: ONS