Covid rates continue to rise in the Leamington, Warwick and Kenilworth area - with two areas well above the national average
and live on Freeview channel 276
Covid rates have continued to rise in Warwickshire since the county was told to stay in tier three last week.
According to the latest figures over the seven days to December 16, Warwickshire's rolling rate of positive tests per 100,000 people is now just over the national average (205.6), after being under the level last week (138.1).
Advertisement
Hide AdAdvertisement
Hide AdAnd these rises have been seen in the Warwick district, which now has a rolling rate of 221.2 per 100,000 - a 25.2% increase compared to the previous seven days.

However, it is worth remembering that the Warwick district's figures are still much lower than many others across the country - the district is 145th out of 315 authorities in terms of positive cases.
And areas in the south of England and London borough have seen alarming increases, which has put them into a new tier four.
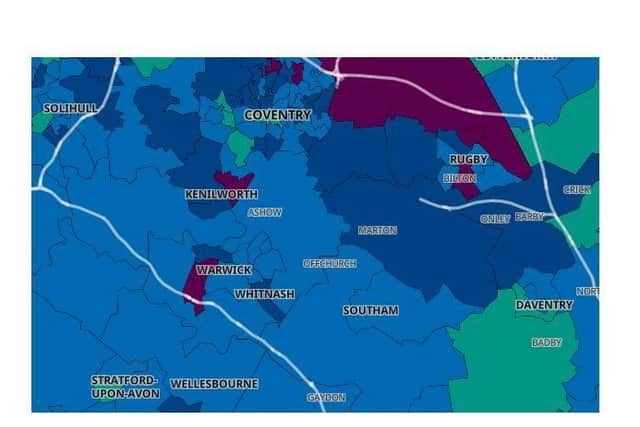
The ward with the highest rate in the Warwick district is Warwick South West and Aylesford, where there has been a 103.4% increase in cases. Their rolling rate is now 468.8 per 100,000 - well above the national average. Contrast this with a neighbouring ward - Warwick South East, Myton and Heathcote - which has seen a decrease in cases and has a rolling rate of 146.2, well under the national average.
Advertisement
Hide AdAdvertisement
Hide AdAnother ward with a high rolling rate is Kenilworth East. They have had a smaller increase in cases (26.9%) but it still have a high rolling rate of 411.2 per 100,000.
The biggest increases in the county are in the Rugby borough, which now has the highest overall rolling rate in Warwickshire with 300.2.
Here are the figures for the seven days to December 16
Seven–day rates are expressed per 100,000 population and are calculated by dividing the seven day count by the area population and multiplying by 100,000.
Warwickshire
Seven days to 16 December 2020
Total cases: 1188
The rate has increased relative to the previous week by 388 (48.5%)
Advertisement
Hide AdAdvertisement
Hide AdRolling rate: 205.6 (which is just over the national average)
Warwick district
Total cases: 318
The rate has increased relative to the previous week by 64 (25.2%)
Rolling rate: 221.2
Stratford-on-Avon
Total cases: 179
The rate has increased relative to the previous week by 85 (90.4%)
Rolling rate: 137.6 (which is below the national average)
Rugby borough
Total cases: 327
The rate has increased relative to the previous week by 187 (133.6%)
Rolling rate: 300.2 (which is above the national average)
Nuneaton and Bedworth
Total cases: 266
Advertisement
Hide AdAdvertisement
Hide AdThe rate has increased relative to the previous week by 49 (22.6%)
Rolling rate: 204.8
North Warwickshire
Total cases: 98
The rate has increased relative to the previous week by 3 (3.2%)
Rolling rate: 150.2